 Skip to content
 Site analysis is the foundation of every architectural project. Before you design, you must understand the site: its sun, wind, slope, view, noise, history, and context. A site analysis presentation communicates this research clearly and persuasively. It is not a list of facts — it is an argument for why your design belongs where it does.
These 12 site analysis architecture presentation ideas span diagrams, maps, collages, and analytical drawings. Each idea includes defining characteristics, graphic strategies, and applications.
1. The Sun Path Diagram
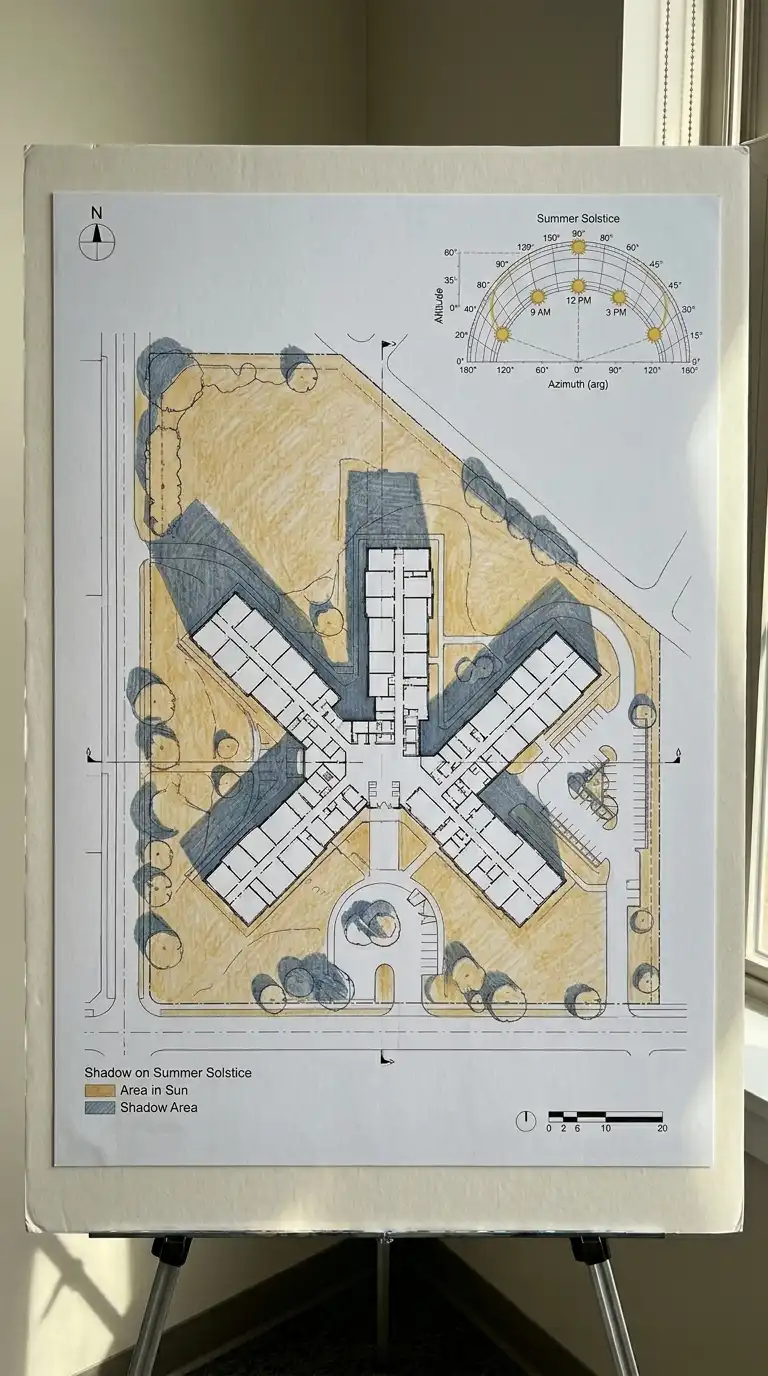
The sun path diagram shows how sunlight moves across the site. The diagram includes the sun path for the site’s latitude, showing angles at different times of year. Shadows are drawn for key times (9am, 12pm, 3pm) on the summer and winter solstices. The sun path diagram is solar, temporal, and shadow-focused.
This diagram is ideal for passive solar design. The emotional effect is solar, temporal, and shadow-focused.
Quick Tips
- Use a standard sun path diagram for the site latitude.
- Draw shadows accurately based on building height and sun angle.
- Use warm colours for sun, cool colours for shade.
2. The Wind Rose Diagram
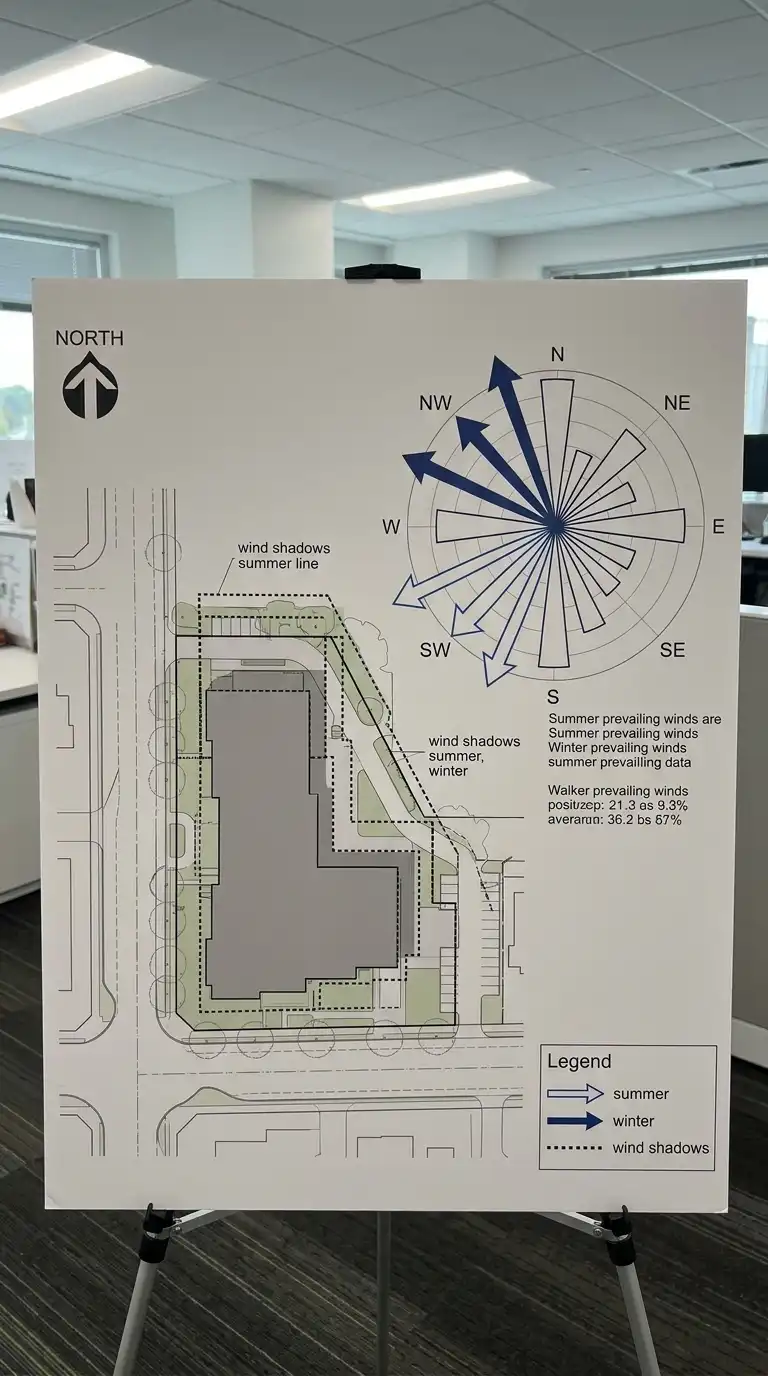
The wind rose diagram shows prevailing wind directions. The diagram includes summer and winter prevailing winds. Wind shadows (areas protected from wind) are marked behind buildings or landforms. The wind rose diagram is climatic, directional, and shelter-focused.
This diagram is ideal for natural ventilation studies. The emotional effect is climatic, directional, and shelter-focused.
Quick Tips
- Distinguish summer and winter winds with different arrow styles.
- Show wind shadows as dotted outlines.
- Include a north arrow and wind rose.
3. The Topographic Analysis
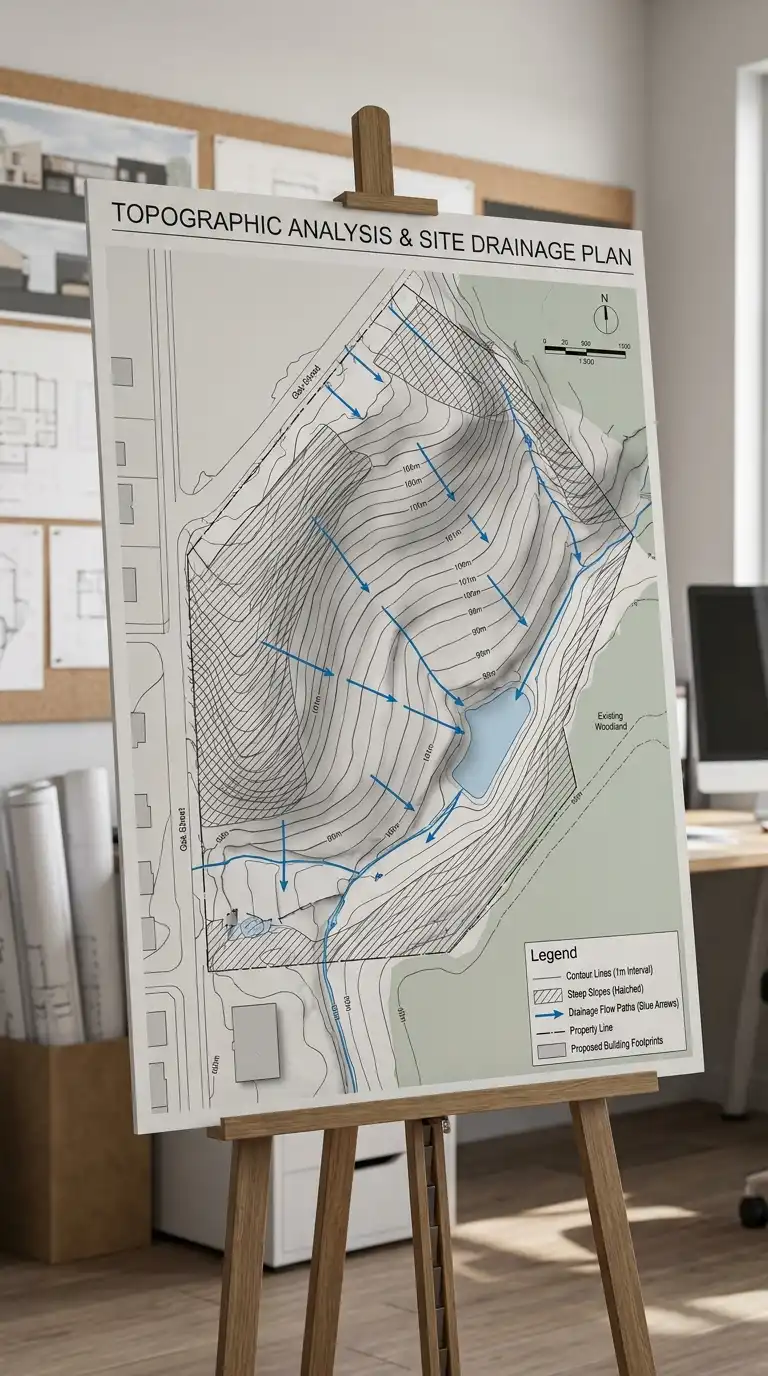
The topographic analysis shows the slope of the site. Contour lines are drawn at regular intervals. Steep slopes are hatched. Flat areas are highlighted. Drainage paths are shown with arrows. The topographic analysis is contoured, sloped, and drained.
This diagram is ideal for site planning and grading. The emotional effect is contoured, sloped, and drained.
Quick Tips
- Draw contour lines at 0.5m or 1m intervals.
- Hatch steep slopes (over 15 percent).
- Show drainage paths with blue arrows.
4. The View Corridor Diagram
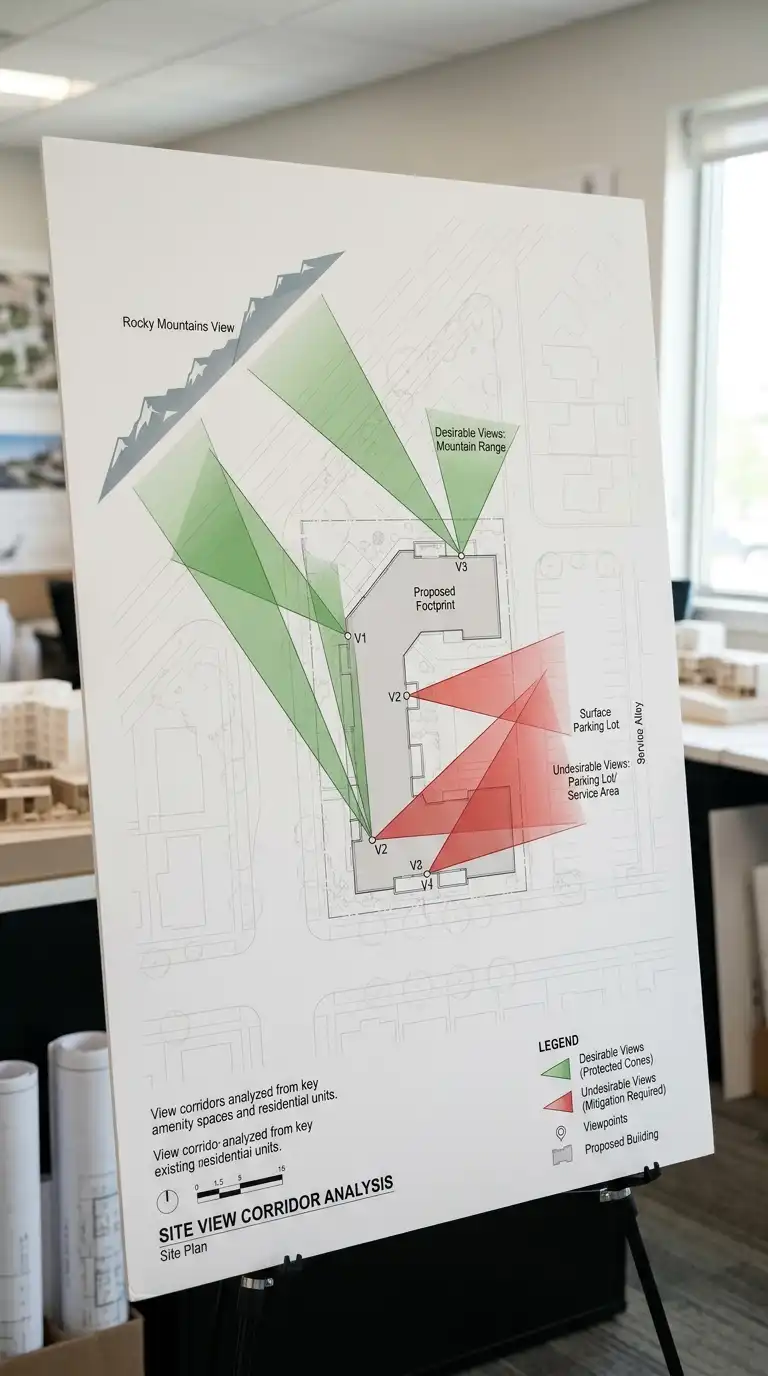
The view corridor diagram shows desirable and undesirable views from the site. View cones are drawn from key points (entrance, living room, terrace). Desirable views (mountains, water, city skyline) are shaded green. Undesirable views (parking lot, highway, industrial area) are shaded red. The view corridor diagram is visual, directional, and view-focused.
This diagram is ideal for siting buildings and windows. The emotional effect is visual, directional, and view-focused.
Quick Tips
- Draw view cones from windows, terraces, and entrances.
- Use green for desirable views, red for undesirable.
- The site plan should be faint.
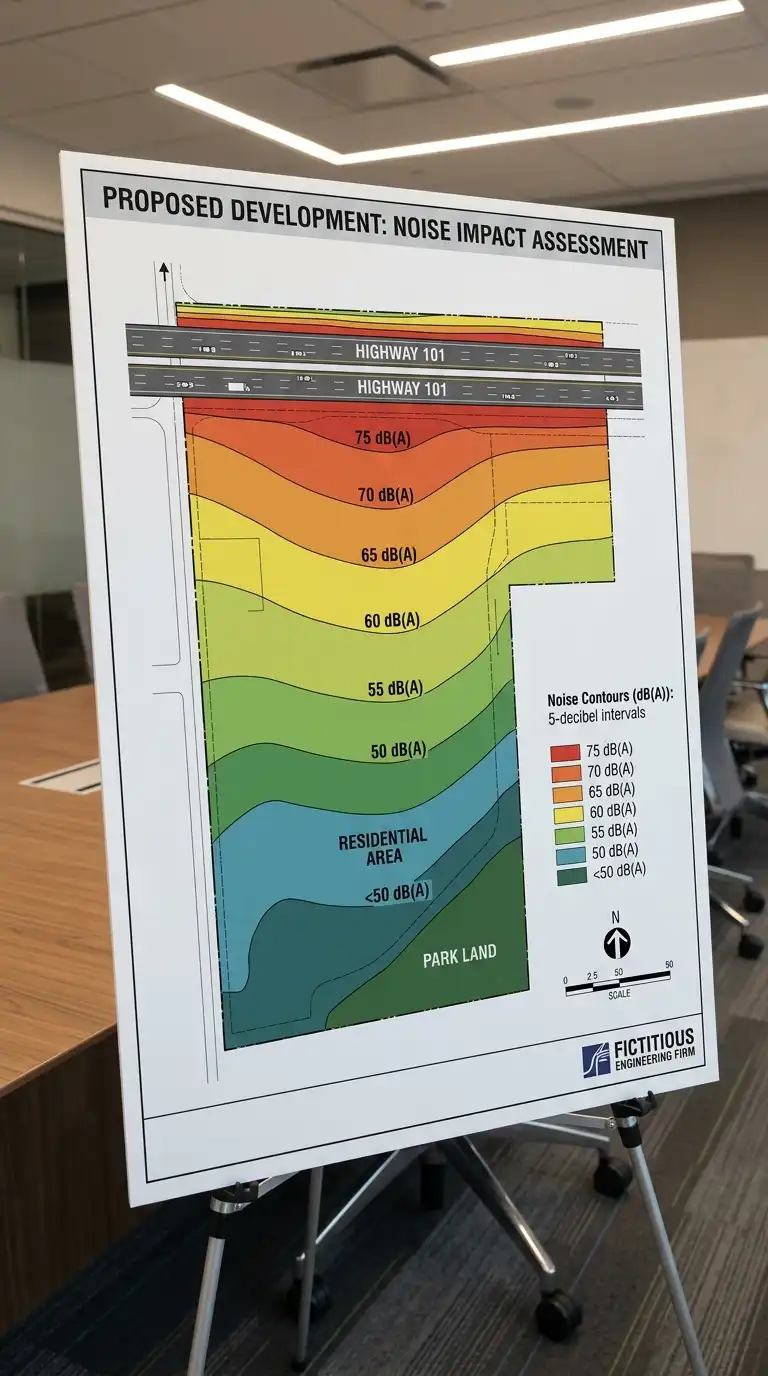
5. The Noise Contour Diagram
The noise contour diagram shows noise sources and their impact. Noise contours are drawn like topographic contours, showing areas of different decibel levels. The noise contour diagram is acoustic, quantitative, and contour-focused.
This diagram is ideal for siting quiet spaces (bedrooms, libraries) away from noise. The emotional effect is acoustic, quantitative, and contour-focused.
Quick Tips
- Draw noise sources (roads, railways, airports) on the diagram.
- Draw noise contours at 5-decibel intervals.
- Quiet spaces should be in the quietest contours.
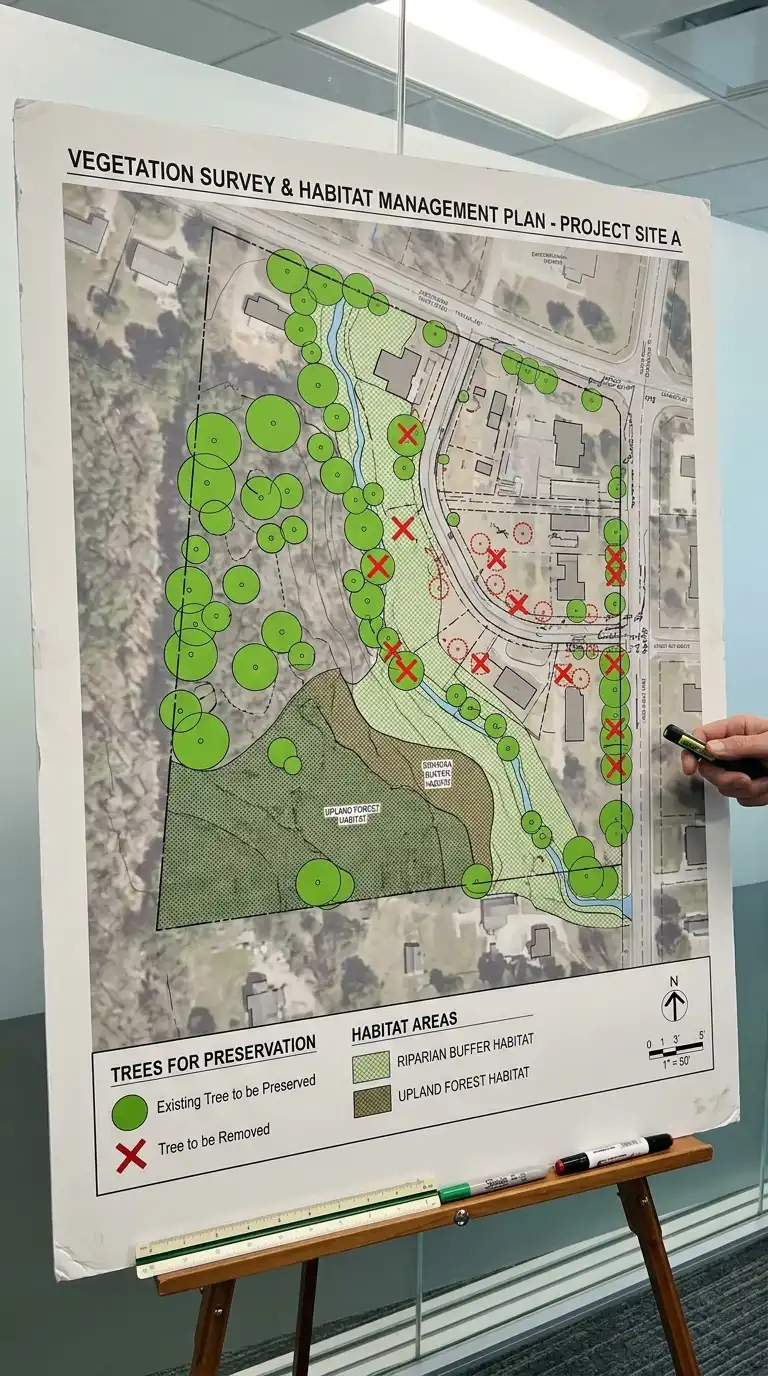
6. The Vegetation and Ecology Diagram
The vegetation and ecology diagram shows existing trees, vegetation, and habitats. Significant trees are marked for preservation. Invasive species are marked for removal. Habitat areas are shaded. The vegetation diagram is ecological, preservational, and habitat-focused.
This diagram is ideal for site preservation and landscape design. The emotional effect is ecological, preservational, and habitat-focused.
Quick Tips
- Mark significant trees for preservation in green.
- Mark invasive species for removal in red.
- Shade habitat areas.
7. The Circulation and Access Diagram
The circulation and access diagram shows how people and vehicles reach the site. Vehicle access points are marked. Pedestrian paths are shown. Desire lines (informal paths worn into grass) are noted. The circulation diagram is access-oriented, pedestrian, and vehicular.
This diagram is ideal for site planning and entrance design. The emotional effect is access-oriented, pedestrian, and vehicular.
Quick Tips
- Mark vehicle access points and turning radii.
- Show pedestrian paths and desire lines.
- Note emergency vehicle access.

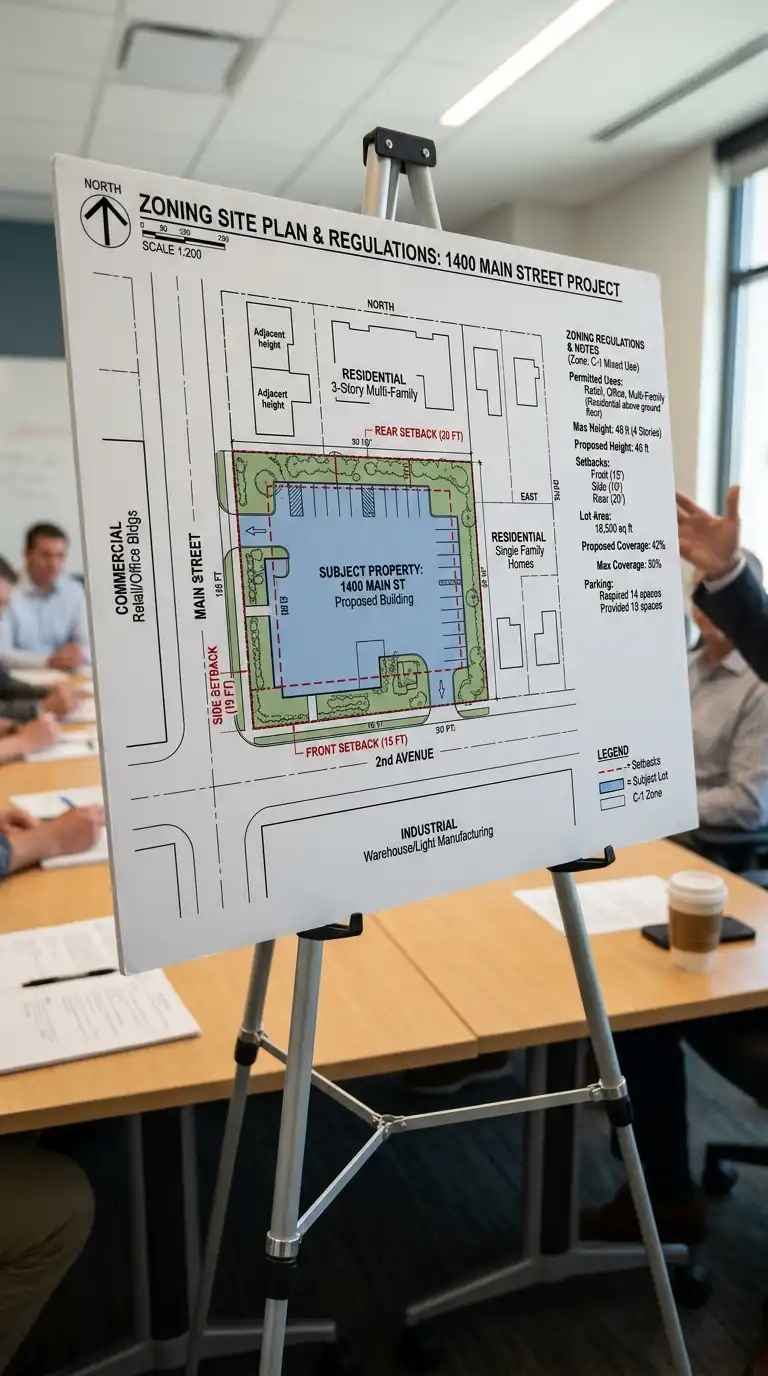
8. The Zoning and Land Use Diagram
The zoning and land use diagram shows adjacent land uses and zoning regulations. Adjacent buildings are labelled by use (residential, commercial, industrial). Zoning setbacks are shown as dashed lines. The zoning diagram is regulatory, contextual, and use-focused.
This diagram is ideal for understanding site constraints. The emotional effect is regulatory, contextual, and use-focused.
Quick Tips
- Label adjacent buildings by use.
- Show zoning setbacks as dashed lines.
- Note permitted uses and height limits.
9. The Historic Layering Diagram
The historic layering diagram shows the history of the site. Historical maps, old photographs, and archival drawings are layered. The site’s evolution over time is shown. The historic layering diagram is temporal, layered, and historical.
This diagram is ideal for sites with significant history. The emotional effect is temporal, layered, and historical.
Quick Tips
- Research the site history before starting.
- Use archival images: old maps, photographs, paintings.
- Show the site’s evolution over time.

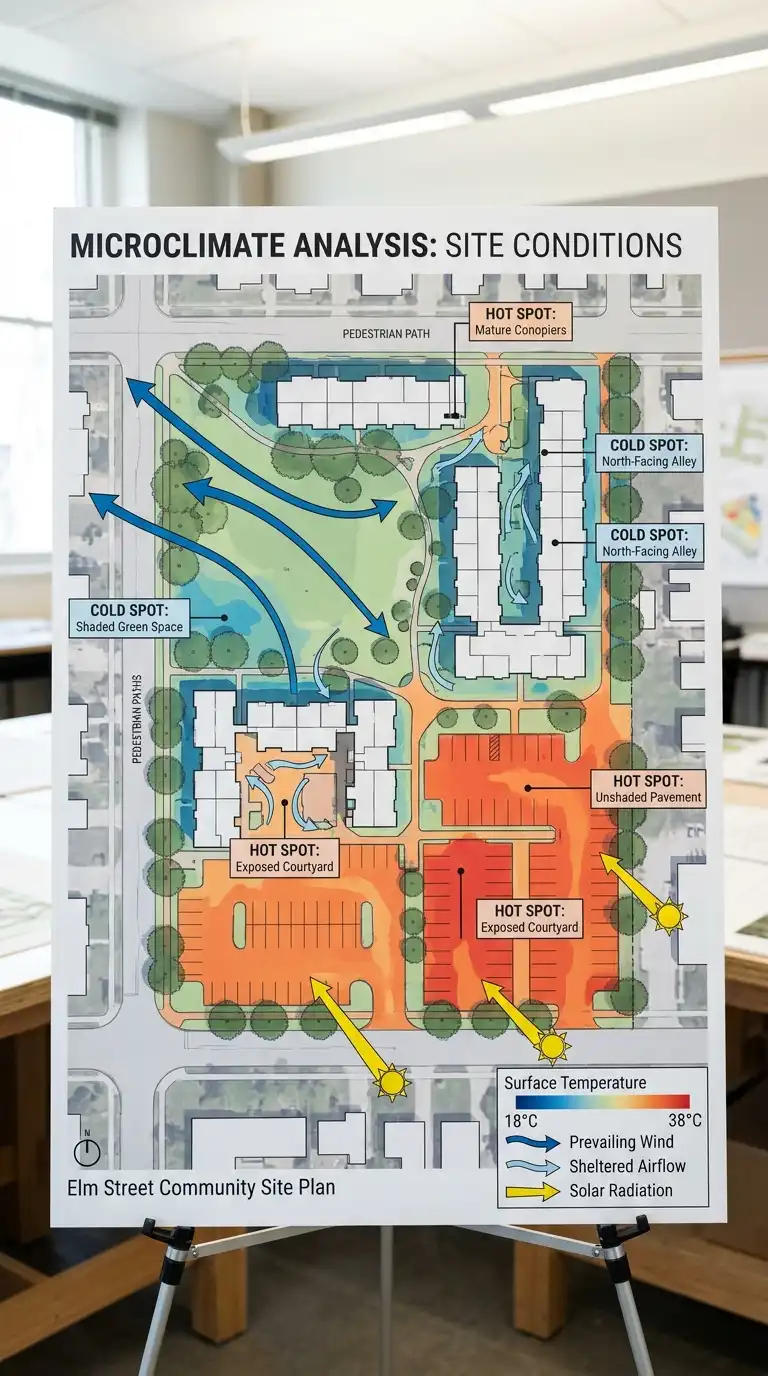
10. The Microclimate Diagram
The microclimate diagram shows local climate conditions on the site. Sun, wind, temperature, humidity, and precipitation are mapped. Hot spots and cold spots are identified. The microclimate diagram is climatic, local, and environmental.
This diagram is ideal for passive design and landscape planning. The emotional effect is climatic, local, and environmental.
Quick Tips
- Map sun, wind, temperature, humidity, and precipitation.
- Identify hot spots and cold spots.
- Use colour to show temperature variations.
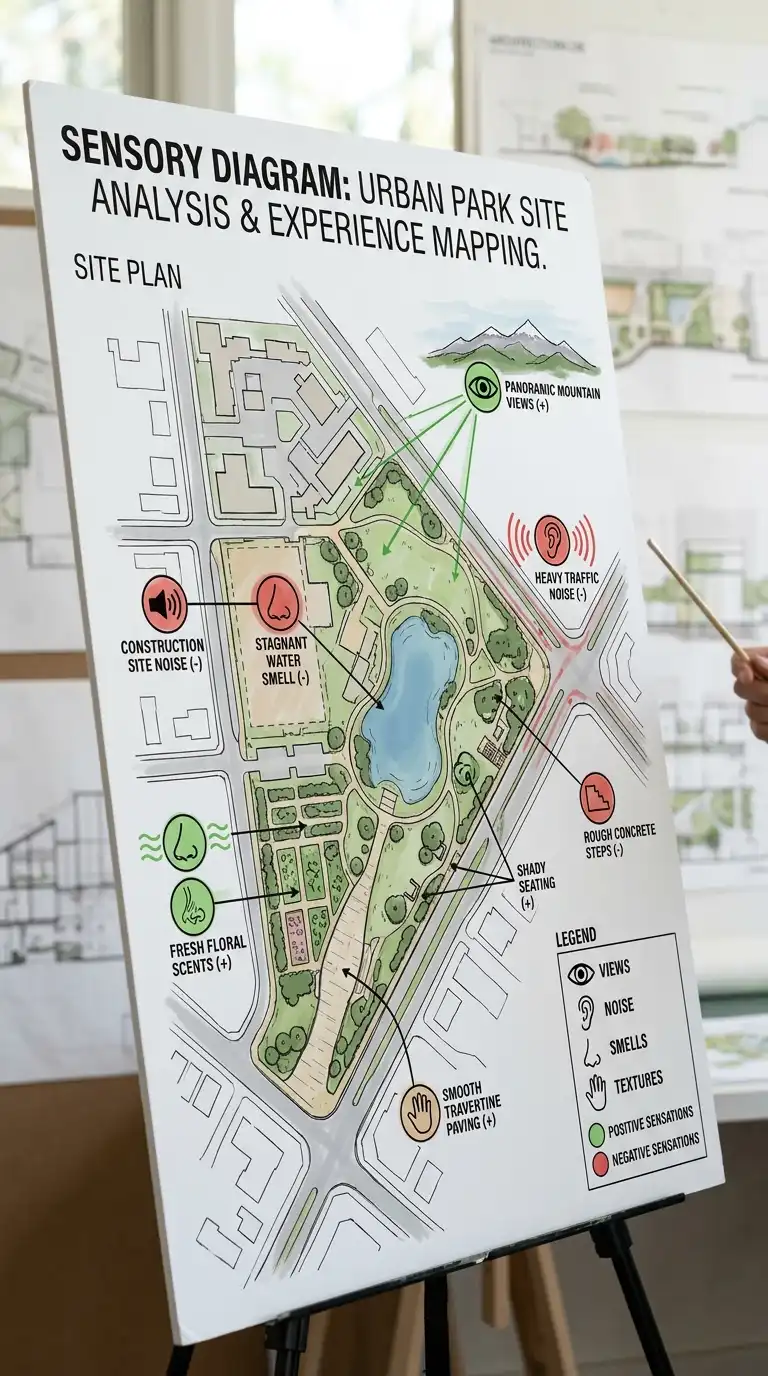
11. The Sensory Diagram
The sensory diagram maps what you see, hear, smell, and feel on the site. Views are marked. Noise sources are noted. Smells (flowers, industry, food) are indicated. Textures (rough stone, smooth glass) are noted. The sensory diagram is sensory, experiential, and qualitative.
This diagram is ideal for understanding the experiential qualities of the site. The emotional effect is sensory, experiential, and qualitative.
Quick Tips
- Map views, noise, smells, and textures.
- Use icons or symbols for each sense.
- Note positive and negative sensations.
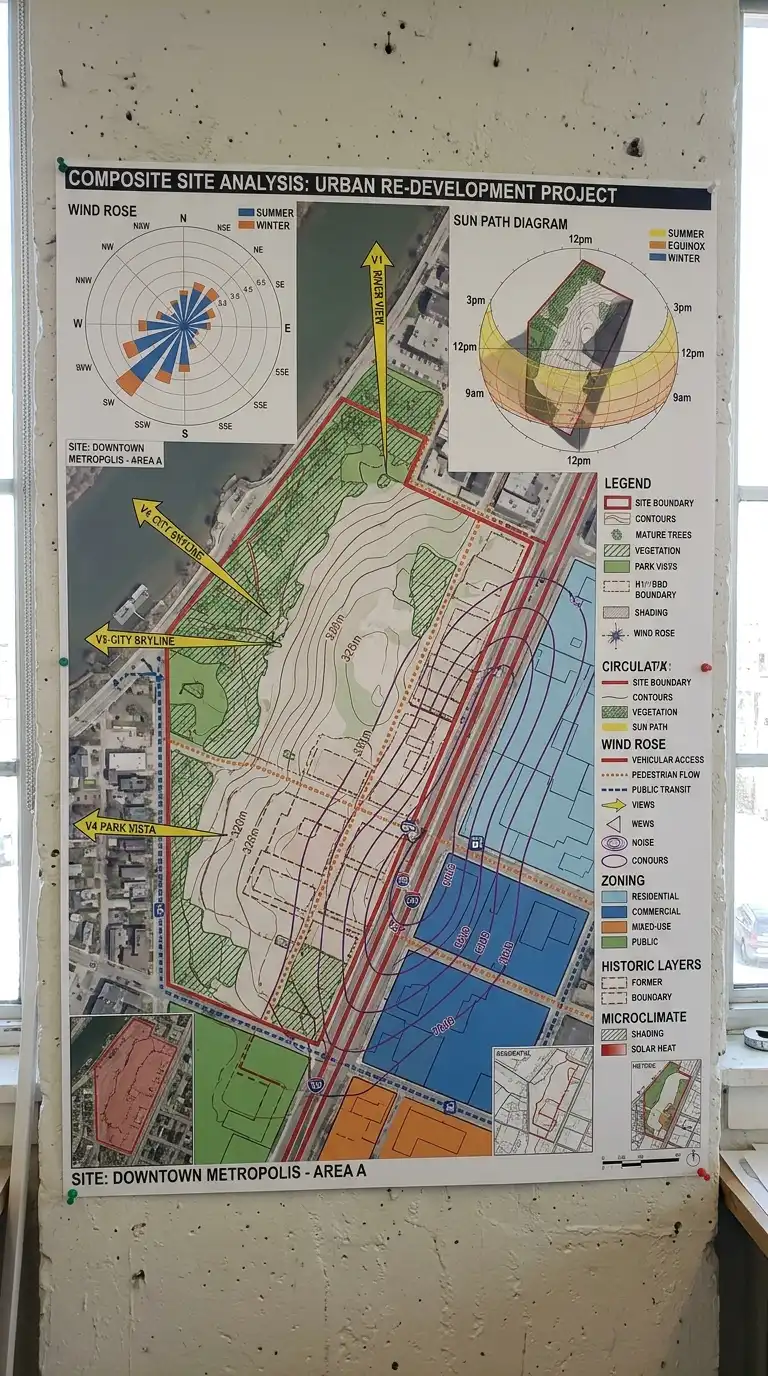
12. The Composite Site Analysis
The composite site analysis combines multiple analysis types on one board. Sun, wind, slope, view, noise, vegetation, circulation, zoning, history, and microclimate are all shown. The composite board is dense, comprehensive, and synthesised.
This diagram is ideal for final site analysis presentations. The emotional effect is dense, comprehensive, and synthesised.
Quick Tips
- Use a consistent colour code across all analysis types.
- Include a legend explaining every symbol.
- Keep the board readable — do not overload it.
Final Thoughts
Site analysis is not a checklist. It is not a list of facts. It is a way of seeing. You study the sun to know where to put windows. You study the wind to know where to put outdoor spaces. You study the slope to know where to put the building. You study the view to know where to put the windows. You study the noise to know where to put the bedrooms. You study the history to know what came before. You study the context to know how to belong.
