Site analysis is the foundation of every good architectural project. Before a single line is drawn, before the massing study begins, before the first client meeting, the architect must understand the site: its sun, wind, soil, noise, views, history, and hidden constraints. A thorough site analysis does not just prevent problems — it generates design ideas. The best buildings emerge from their sites because the architect listened carefully to what the site had to say.
These 9 site analysis examples cover the essential categories of investigation. Each example includes what to look for, how to record it, and how to translate findings into design decisions.
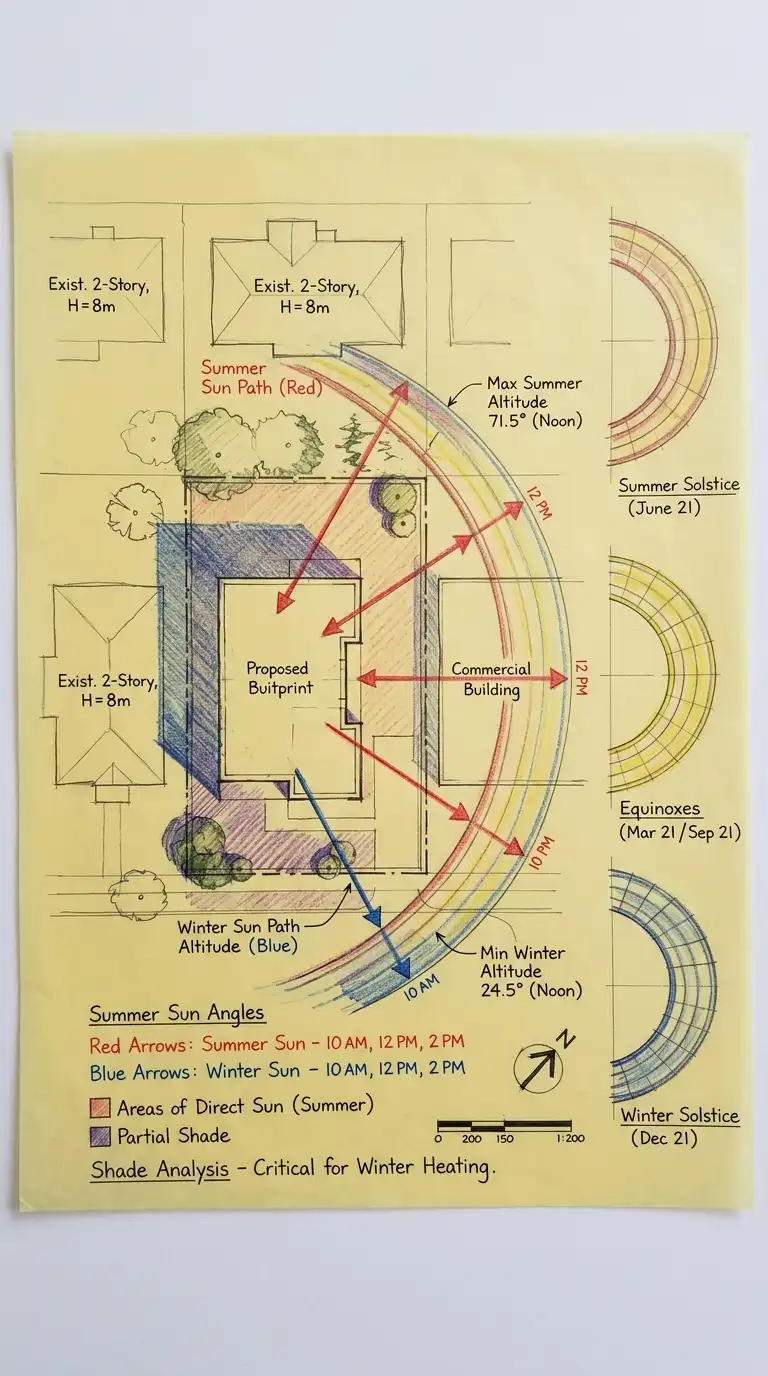
1. Sun Path and Solar Analysis
Sun path analysis is the single most useful site analysis tool. It tells you where the sun rises and sets across the seasons, which facades will overheat in summer, which rooms will be dark in winter, and where to place windows, shading devices, and outdoor spaces.
To complete a sun path analysis, overlay a sun path diagram (specific to your site’s latitude) onto your site plan. For each significant facade and outdoor space, note the sun angles at key times: 9am, 12pm, and 3pm on the summer solstice (June 21), the equinoxes (March 20 and September 22), and the winter solstice (December 21). Shade the areas that receive direct sun. Identify areas in permanent shade from neighbouring buildings or trees. Use colour coding: red for high solar gain, blue for permanent shade, yellow for partial sun.
Quick Tips
- Use free online tools like SunCalc or Ladybug Tools to generate accurate sun path diagrams.
- Photograph the site at the same times you are analysing — the camera does not lie.
- Design outdoor spaces on the north side of buildings in hot climates, south side in cold climates.
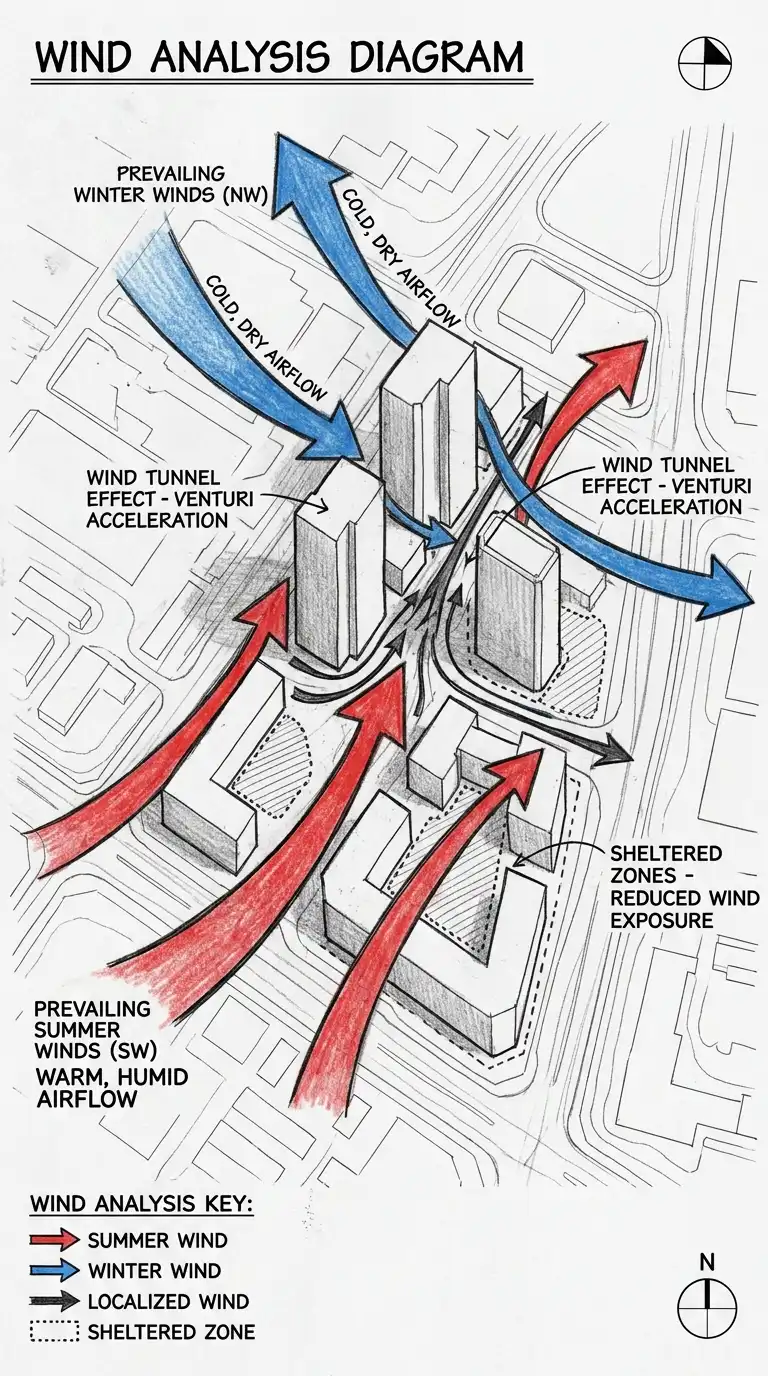
2. Wind and Ventilation Analysis
Wind analysis reveals how air moves across your site. Prevailing wind directions determine natural ventilation potential, winter heat loss, and the comfort of outdoor spaces. A building that works with the wind, not against it, requires less energy for heating and cooling.
Collect local wind data from weather stations or climate databases showing average wind speeds and directions by season. On your site plan, draw arrows indicating prevailing summer winds (typically from the south or southwest in the northern hemisphere) and winter winds (typically from the north or northwest). Identify wind tunnels created by adjacent buildings and sheltered zones where air is still. Mark areas where wind speed exceeds comfortable levels for outdoor use (above 5 metres per second).
Quick Tips
- Prevailing wind data is available from national weather services and airport weather stations.
- On-site observation is essential — spend a windy day on the site with an anemometer.
- Place outdoor seating in sheltered zones. Place composting or waste areas downwind.
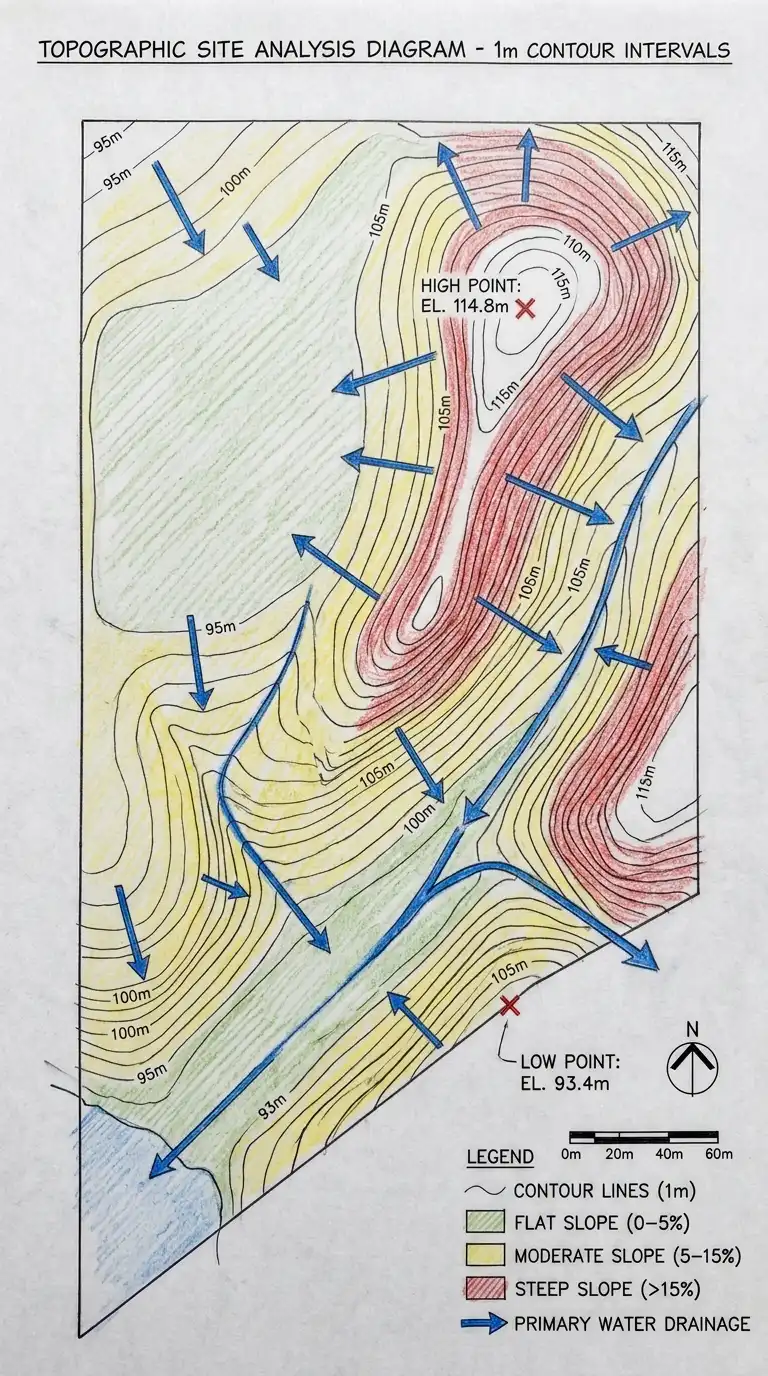
3. Topographic and Slope Analysis
Topography determines where you can build, how water moves across the site, and how the building will relate to the ground. A careful topographic analysis prevents expensive grading, foundation problems, and drainage disasters.
Obtain a topographic survey or generate a contour map of the site with contour intervals of 0.5 metres or 1 metre. Identify flat areas (slope less than 5%) suitable for building without grading. Identify moderate slopes (5-15%) suitable for split-level or stepped foundations. Identify steep slopes (over 15%) where building is difficult or impossible without significant earthwork. Draw arrows showing drainage paths perpendicular to contour lines. Mark the highest and lowest points on the site. Calculate total elevation change across the site.
Quick Tips
- Slope percentage is calculated as rise divided by run, multiplied by 100.
- South-facing slopes receive more sun in the northern hemisphere — ideal for solar exposure.
- North-facing slopes remain cooler and wetter — better for forest retention.
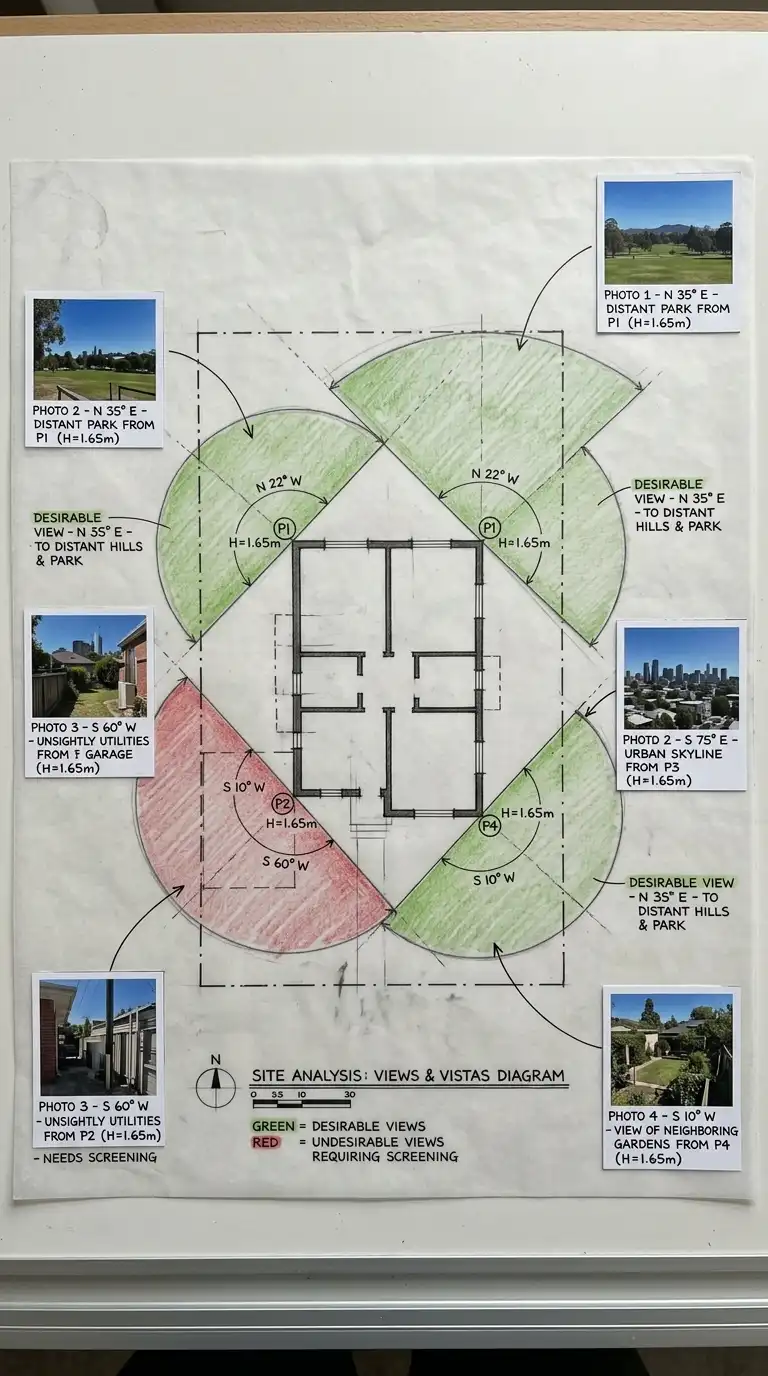
4. Views and Vistas Analysis
What can you see from the site? What can see you? Views analysis identifies the site’s visual assets (distant mountains, city skylines, water bodies, mature trees) and liabilities (industrial buildings, highways, parking lots, utility infrastructure).
From every significant point on the site — future building corners, outdoor seating areas, entrance paths — record the view in each direction. Use a compass to note orientation. Photograph the view from each point at eye level. Draw view cones on your site plan showing which directions capture valuable views and which directions require screening. Mark the location of any unsightly elements that must be blocked. Note the height of the viewer: a seated person sees differently than a standing person.
Quick Tips
- Use a smartphone panorama function to capture wide views systematically.
- Mark view corridors that should remain unobstructed by the new building.
- Negative views can be blocked with walls, screens, landscaping, or strategic building placement.
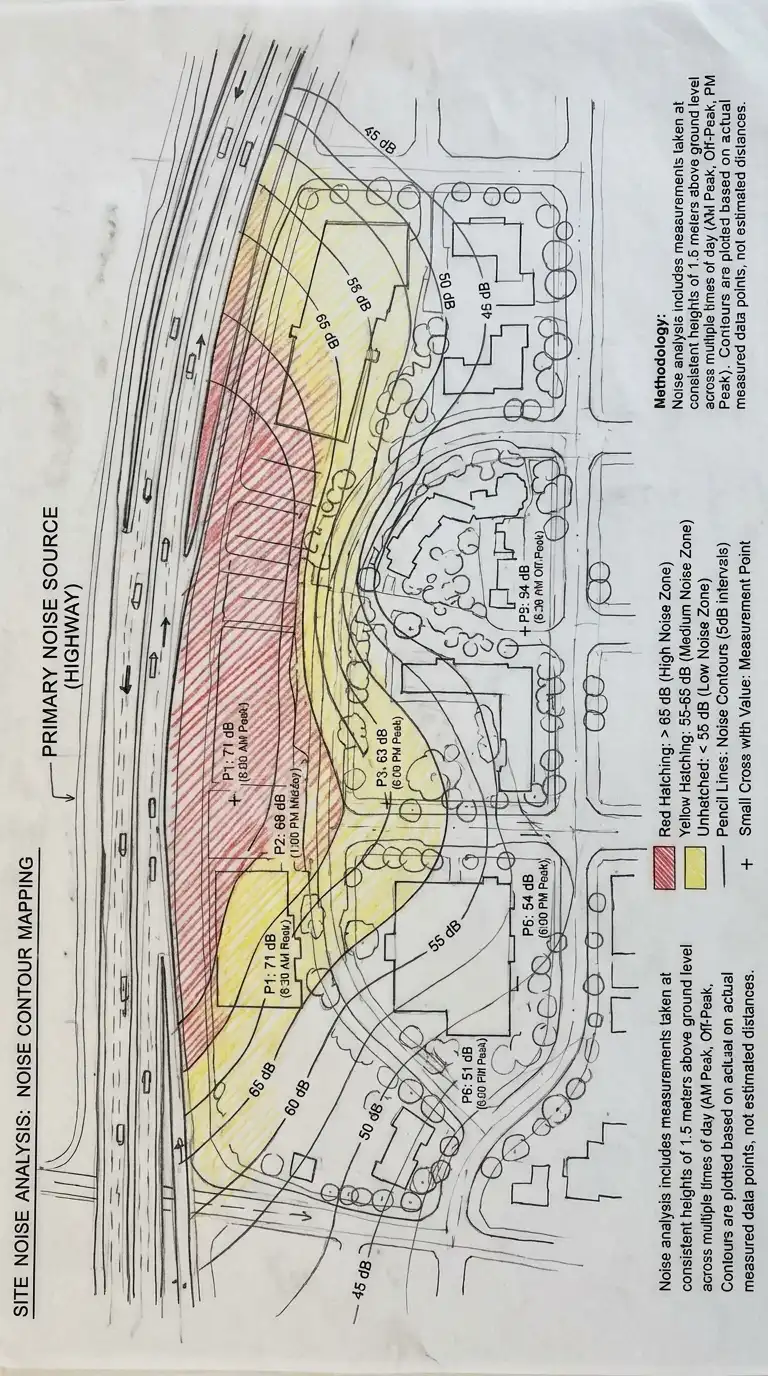
5. Noise and Soundscape Analysis
Noise is invisible but unforgettable once you live with it. Noise analysis identifies sound sources, their intensity, and their impact on different areas of the site. The difference between a peaceful bedroom and a sleepless night is often a few metres of setback.
Walk the site at different times of day — morning rush hour, midday, evening rush hour, late night. Mark the location of all noise sources: roads, railways, airports, industrial facilities, mechanical equipment, schools, sports fields, entertainment districts. Use a sound level meter app to measure decibel levels at each point. Draw noise contours on your site plan showing areas above 65 decibels (uncomfortable for outdoor conversation), 55-65 decibels (acceptable with mitigation), and below 55 decibels (quiet). Identify natural sound buffers like hills, dense trees, and existing walls.
Quick Tips
- Traffic noise is loudest during morning and evening rush hours — measure both.
- Decibels are logarithmic: a 10 decibel increase sounds twice as loud.
- Solid barriers block noise; porous barriers like trees only reduce noise slightly.
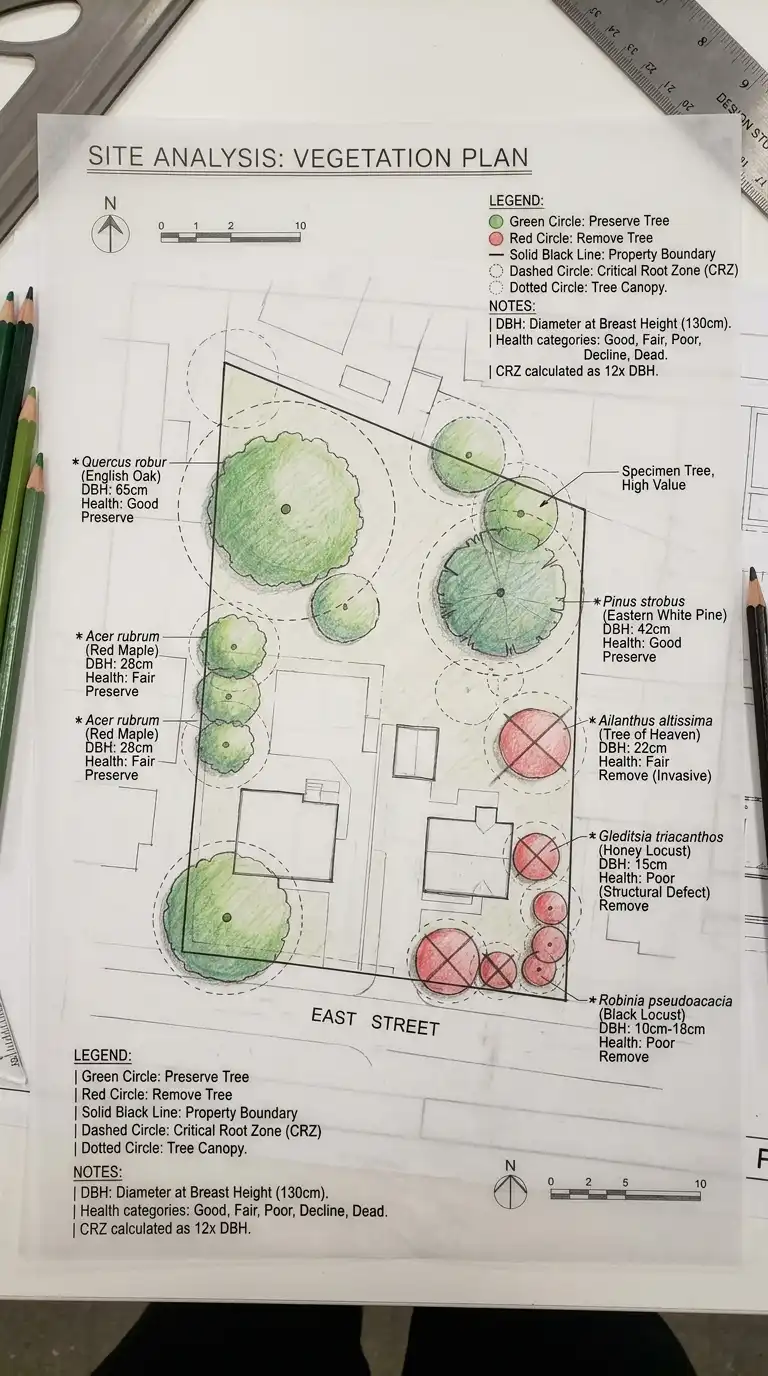
6. Vegetation and Ecology Analysis
Existing vegetation is a site asset that takes decades to replace. A mature oak tree, a hedgerow, a wetland edge — these are not obstacles to design. They are design opportunities that give a project instant maturity, habitat value, and climate resilience.
Conduct a tree survey identifying every tree over 15cm trunk diameter. Record species, trunk diameter, canopy spread, height, health (excellent, fair, poor, dead), and root zone extent. Mark trees for preservation (healthy, significant species, good location), removal (dead, diseased, or invasive species), or relocation (healthy but poorly placed). Identify other vegetation communities: meadows, wetlands, hedgerows, specimen shrubs. Note any protected species or habitats requiring permits. Draw a vegetation overlay showing all significant plants and their protection zones.
Quick Tips
- The critical root zone of a tree extends roughly 30cm from the trunk for every 2.5cm of trunk diameter.
- Construction within the critical root zone will damage or kill the tree.
- Native species are always preferable to exotics for ecological value and maintenance.
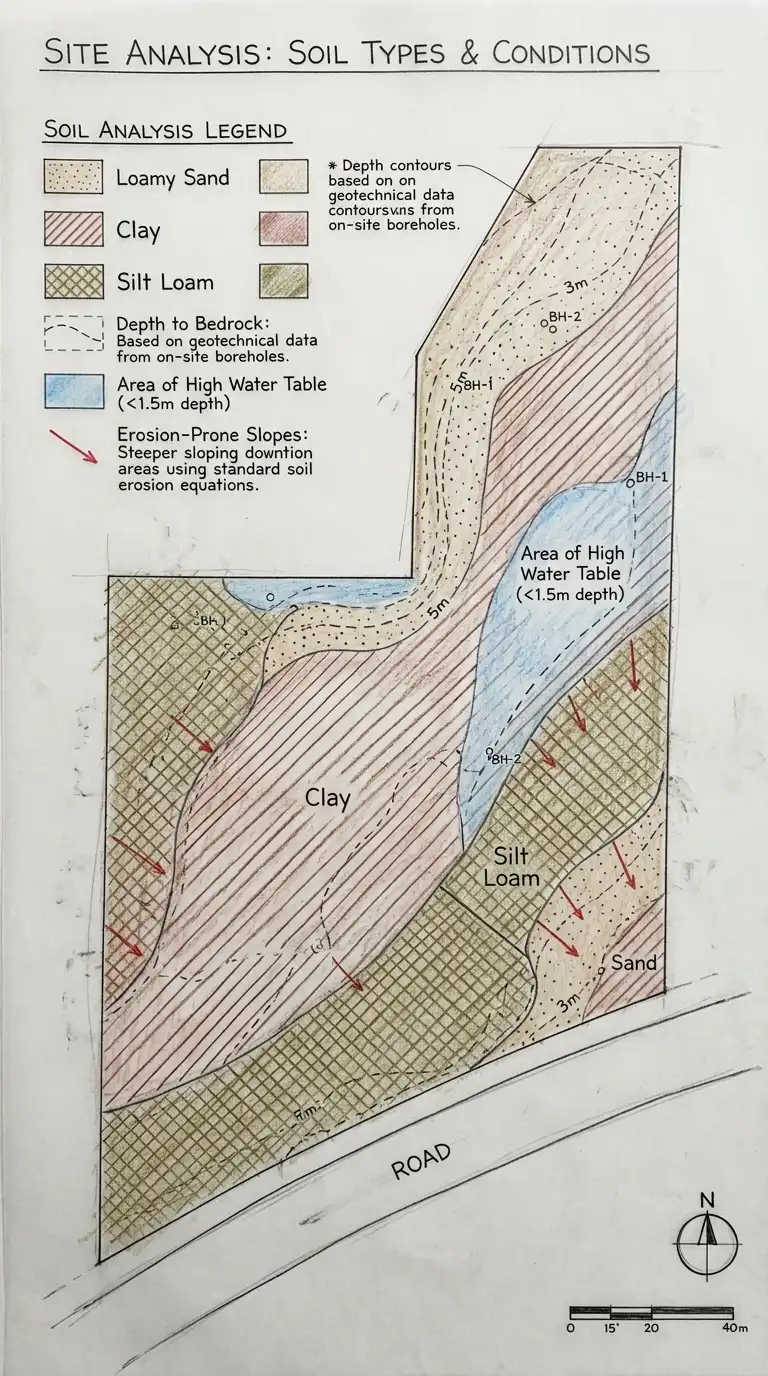
7. Soil and Geology Analysis
Soil determines foundation costs, drainage strategies, and landscape possibilities. A building on sand costs less to excavate but requires different foundations than a building on clay. Soil analysis prevents the expensive surprise of hitting rock where you expected dirt.
Obtain a geotechnical soil report for the site, or conduct a preliminary analysis using soil survey maps from the Natural Resources Conservation Service (or equivalent national agency). Identify soil types: sand (drains well, stable), clay (expands when wet, contracts when dry, problematic for foundations), silt (poor drainage, erosion prone), loam (ideal for planting). Note depth to bedrock, depth to water table, and any contaminated soils requiring remediation. Identify erosion-prone areas and stable building pads.
Quick Tips
- A percolation test determines how fast water drains through soil — essential for septic systems.
- Clay soils require deep foundations or engineered slabs to prevent movement.
- Fill soils (imported to the site) are unpredictable — assume they need removal or deep compaction.
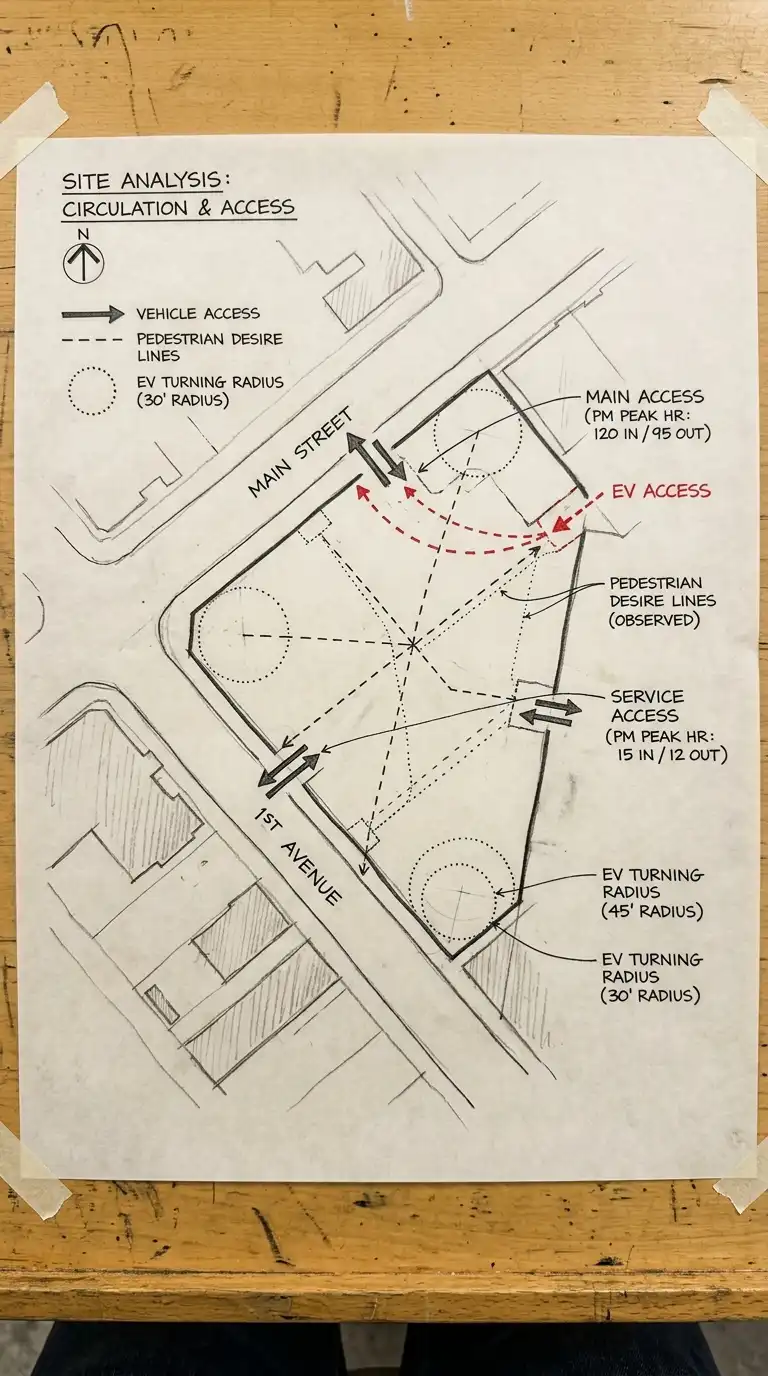
8. Circulation and Access Analysis
How do people, vehicles, and services reach the site? Circulation analysis maps every point of entry and every path across the site. It identifies conflicts between pedestrians and vehicles, opportunities for accessible routes, and the logical location for building entrances.
Draw the site plan and extend it to include adjacent streets, sidewalks, driveways, and pathways. Mark all vehicle access points and their turning radii. Mark pedestrian access points from sidewalks, transit stops, and parking areas. Note emergency vehicle access requirements. Observe and record the actual number of pedestrians and vehicles using each access point during peak hours. Identify desire lines — informal paths worn into grass where people walk despite no official path. These indicate where people actually want to go, not where the existing design tells them to go.
Quick Tips
- Desire lines are design gold. Put a path where people are already walking.
- Fire truck access requires minimum 4 metre width and 4 metre vertical clearance.
- Accessible routes must be continuous, firm, and have slopes under 5%.
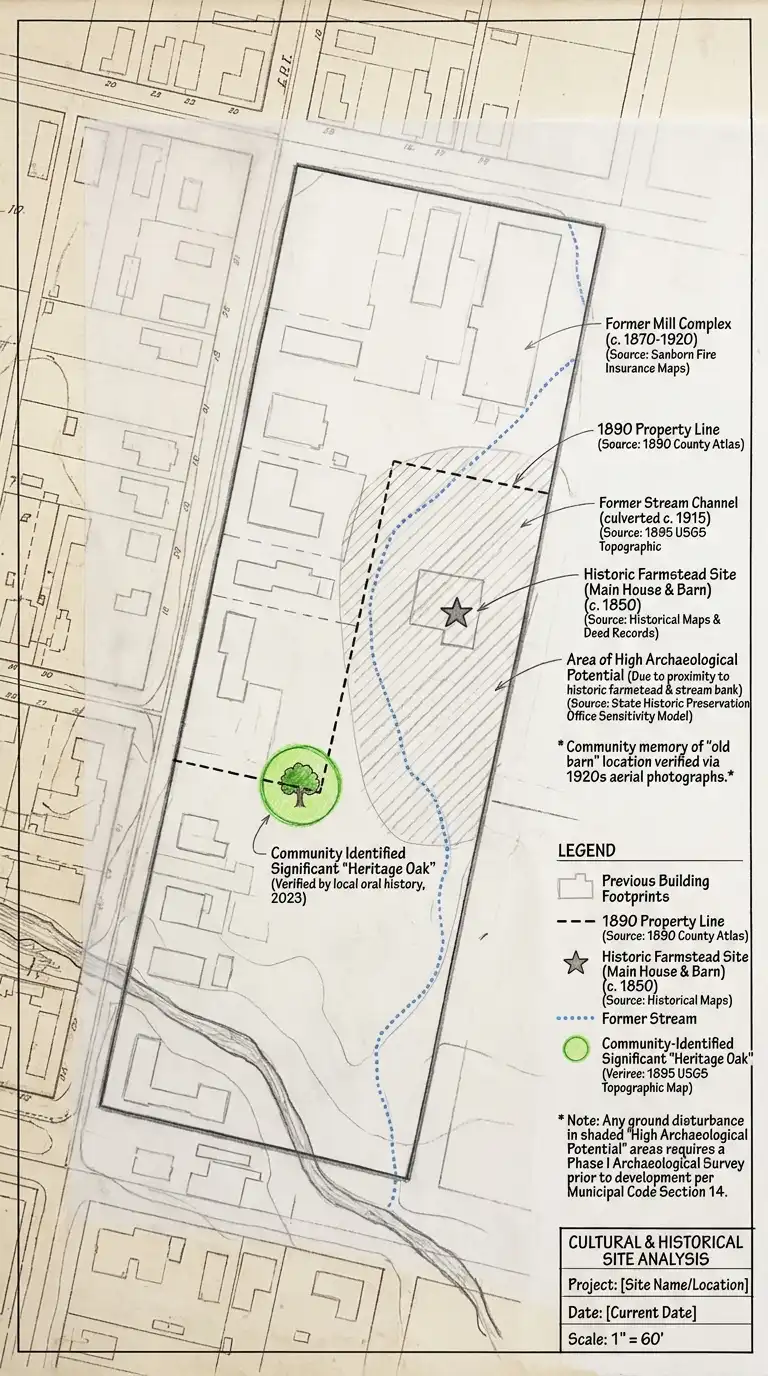
9. Cultural and Historical Analysis
Every site has a history. The cultural and historical analysis uncovers what came before — indigenous land use, agricultural patterns, industrial past, previous buildings, community memories. This analysis prevents the erasure of significant history and can generate rich design concepts.
Research the site’s history through historical maps (Sanborn maps, plat maps, aerial photographs), property records, local historical societies, and oral histories. Identify any historic structures, archaeological potential, or culturally significant landscapes. Note the site’s original vegetation and land use before development. Record any community associations with the site — a beloved tree, a gathering place, a memory. Mark property boundaries and easements that have changed over time. Identify any requirements for historic preservation review or tribal consultation.
Quick Tips
- Sanborn fire insurance maps (available online for many US cities) show building footprints back to the 1860s.
- Aerial photographs from the 1930s to present show land use changes over nearly a century.
- Consult with local indigenous groups if the site has potential for unmarked graves or cultural resources.
Final Thoughts
Site analysis is not a checklist to complete before design begins. It is an ongoing conversation between the architect and the place. The best projects revisit site analysis throughout design, discovering new opportunities in the sun path, a forgotten view, a desire line, a piece of history.
These nine analysis types cover the essential categories, but every site has its own specific demands. A coastal site requires storm surge analysis. A brownfield requires contamination testing. A rural site requires well and septic analysis. Listen to the site. It will tell you what it needs.
IMAGE PROMPT AND ACCURACY INSTRUCTION: A composite site analysis diagram showing all nine analysis types overlaid on a single site plan. Sun path arrows, wind arrows, topographic contours, view cones, noise contours, tree circles, soil patterns, circulation arrows, and historical features all visible. Each analysis type uses a distinct colour and line weight. A legend explains all symbols. Pencil and coloured pencil on trace paper. Composite site analysis must not obscure underlying information. Overlapping data must be legible through line weight and colour hierarchy. A complete legend must explain every symbol, hatch, and colour. All measurements must be consistent across analysis types. The north arrow and scale bar must be prominently visible.